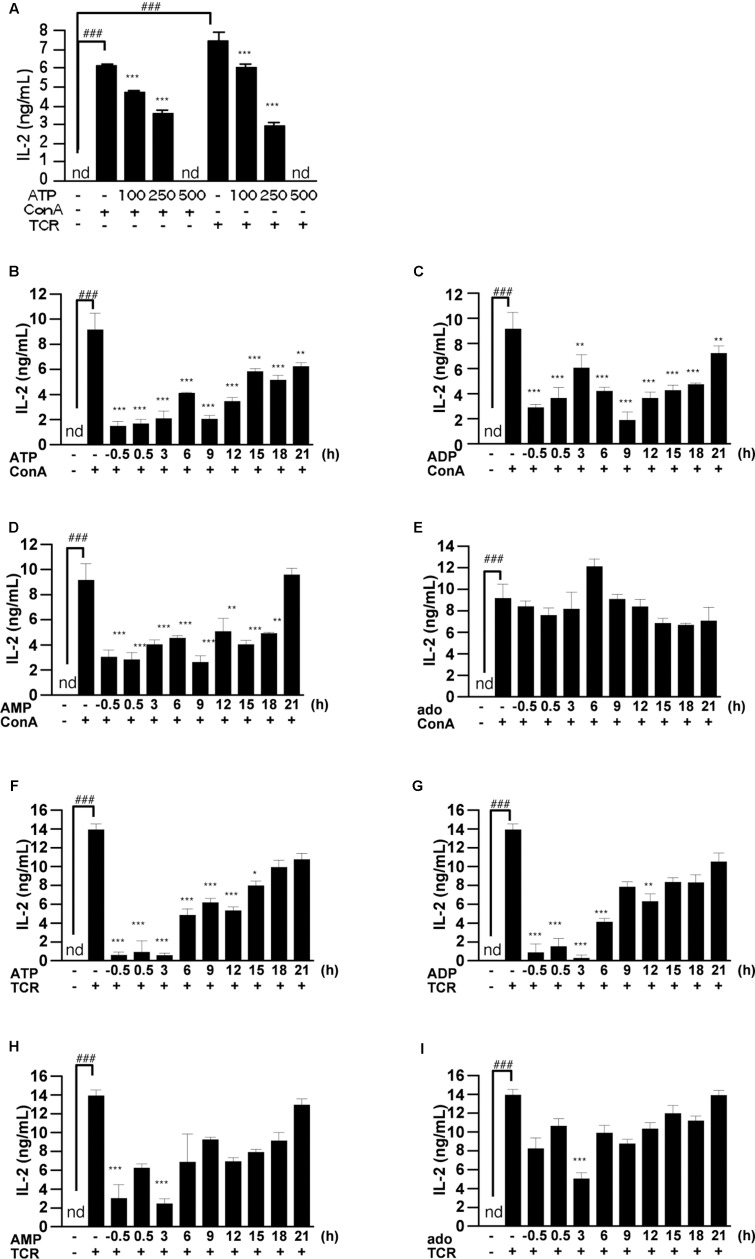
FIGURE 5.
Effect of ATP, ADP, AMP, and adenosine on already activated T cells. (A) Lymphocytes were pre-incubated with ATP (100, 250, and 500 μM), and then stimulated with 50 μg/mL ConA or with plate-bound anti CD3ε mAb and soluble anti CD28 mAb for 24 h. Concentrations of IL-2 in the culture medium were measured by ELISA. (B–I) Lymphocytes were post-treated with ATP, ADP, AMP, and adenosine at the indicated time points after treatment with 50 μg/mL ConA (B–E) or with plate-bound anti CD3ε mAb and soluble anti CD28 mAb (F–I). Cells were incubated for 24 h with ConA or the antibodies. Concentrations of IL-2 in the culture medium were measured by means of ELISA. Each value represents the mean ± SE (n = 4). Significant difference between the vehicle control group or the vehicle plus TCR group and the corresponding ConA-treated group in the absence of ligand is indicated by ###P < 0.001. Significant differences between ConA-treated groups without ligand treatment and the corresponding groups given the indicated ligand treatment are indicated by ∗∗∗P < 0.001 and ∗∗P < 0.01. Each figure is representative of several independent experiments.

