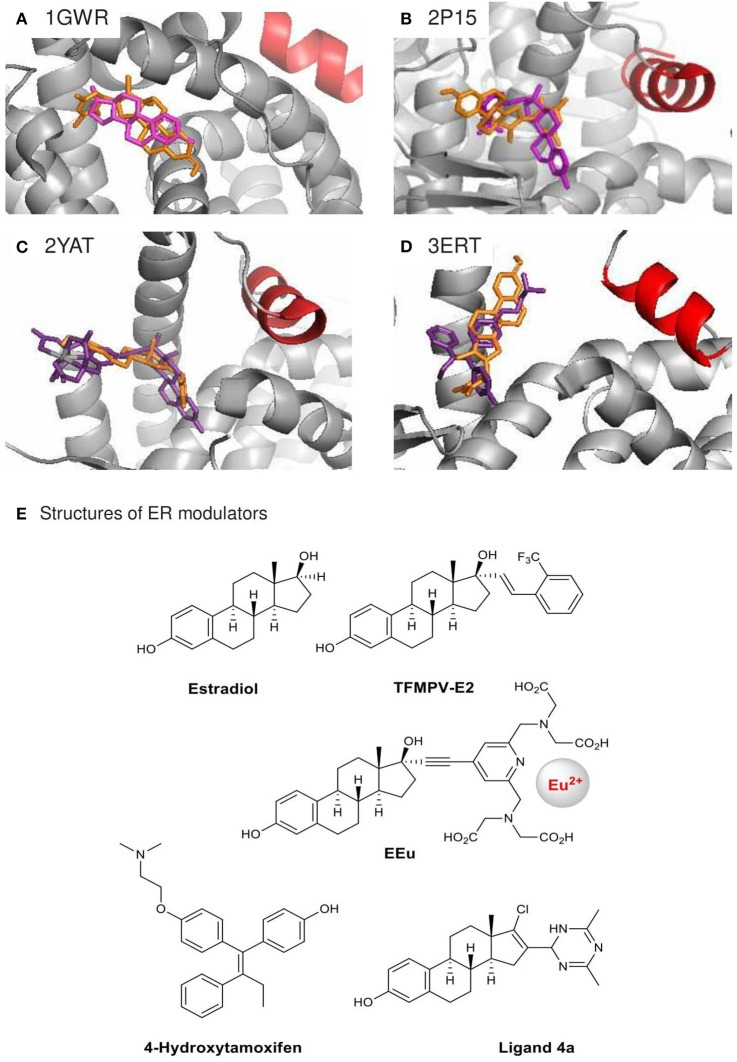
Figure 3.
Crystal structures of agonist-bound ERα 1GWR (A), 2P15 (B), 2YAT (C) and antagonist-bound 3ERT (D) used in the docking analysis of ER modulator 4a. Their original ligands (E) are in purple, modulator 4a in orange, and helix 12 in red. Only the highest ranked poses with the strongest BA were selected: (A) +0.1 kcal/mol, (B) −8.1 kcal/mol, (C) −8.9 kcal/mol, (D) −8.9 kcal/mol.

