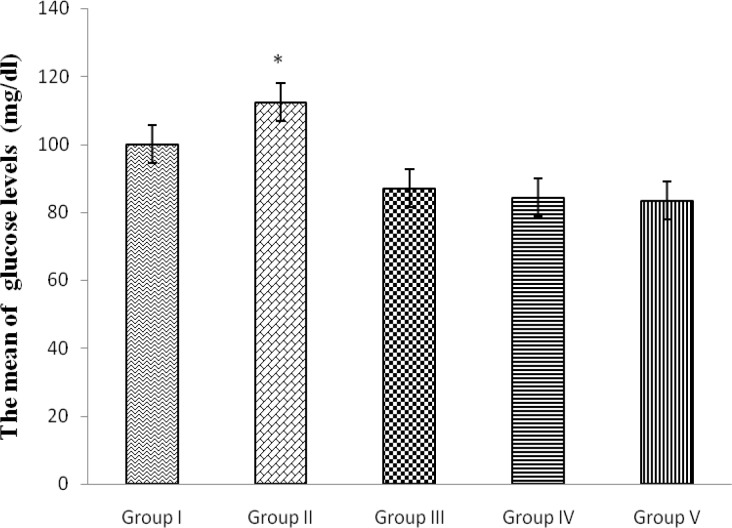
Figure 1.
The mean serum levels of glucose (mg/dl) in control (group I), induced PCOS or sham (group II), Citrullus colocynthis extract (group III), metformin (group IV) and Citrullus colocynthis extract and metformin (group V) (n=8/each). Data were analyses by one-way ANOVA test.* shows significant difference of sham group with III, IV and V groups (p≤0.001

