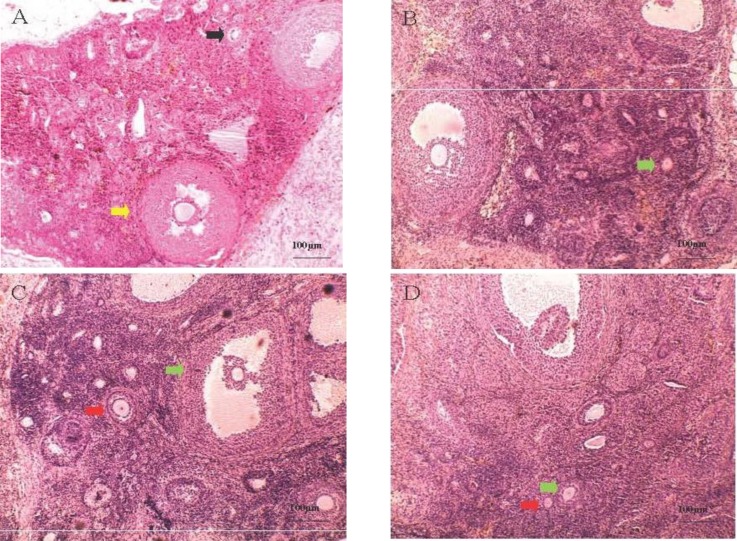
Figure 3.
a) Group II: yellow and black arrows show the development of preantral and primordial follicles respectively. b) Group IV: green arrow shows the development of primary follicles. c) Group III: green and red arrows show the development of antral and primary follicles respectively. d) Group V: green and red arrows show the development of primary and primordial follicles respectively. Animals were divided into control (group I), induced PCOS or sham (group II), plant extract (group III), metformin (group IV) and plant extract and metformin (group V) (n=8/ each group) (magnification 200X

