
Figure 2. Slower behavioural recovery occurs after Lb‐SCC than after Th‐SCC.
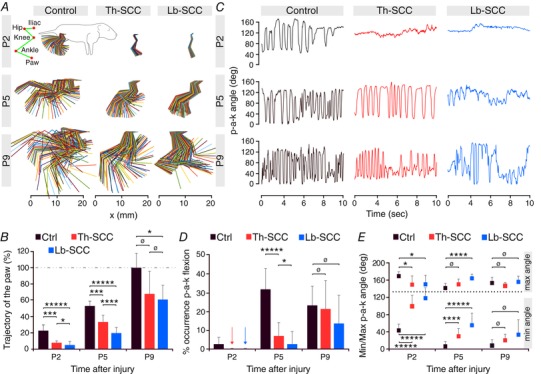
A, kinematic analysis of hindlimb movements at P2, P5 and P9 showing hindlimb movement amplitudes in Th‐SCC, Lb‐SCC and age‐matched uninjured control mice. B, paw trajectory in injured mice as a percentage of that in P9 control mice. C, variation of the paw‐ankle‐knee (p‐a‐k) angle. D, percentage of flexion as assessed within the range of 0–45 deg of the p‐a‐k angle. Arrows represent nil values. E, minimum and maximum values of the p‐a‐k angle. Error bars represent SD. * P < 0.05; *** P < 0.01; **** P < 0.005; ***** P < 0.001; ø P > 0.05.