
Figure 8. Dose dependence of NMDA on the rhythmic output of the locomotor CPG in isolated spinal cords from P4 Lb‐SCC and uninjured control mice.
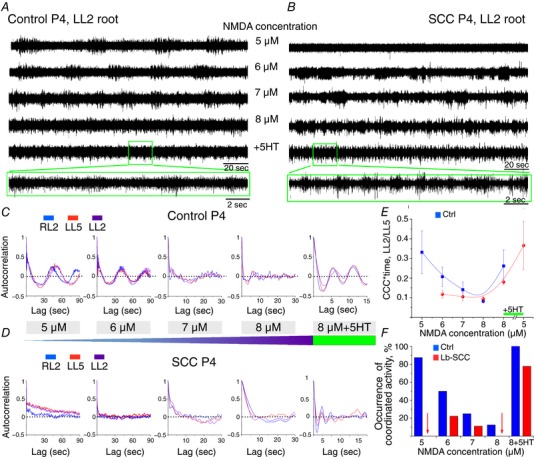
Representative LL2 root activity elicited by exposure to a constant DA concentration (50 μm) with step increases in NMDA concentration (5–8 μm), with 10 μm serotonin added as a last step, in P4 control (A) and Lb‐SCC (B) preparations. Autocorrelation of rhythmic activity in RL2, LL5 and LL2 ventral roots with step increase in NMDA concentration and subsequent addition of serotonin in P4 control (C) and P4 Lb‐SCC (D) preparations. E, NMDA dose–response on cross‐correlation coefficient (CCC) integrated by time for the ventral root pair LL2/LL5. F, occurrence of coordinated rhythmic activity in control (n = 8) and Lb‐SCC (n = 9) preparations with step increases of NMDA concentration and subsequent addition of serotonin. The data represent the percentage of coordinated activity within each group. Red arrows indicate nil value.