
Figure 4. Grand‐averaged waveforms from the VEP experiment divided for condition, viewing distance and spatial frequency.
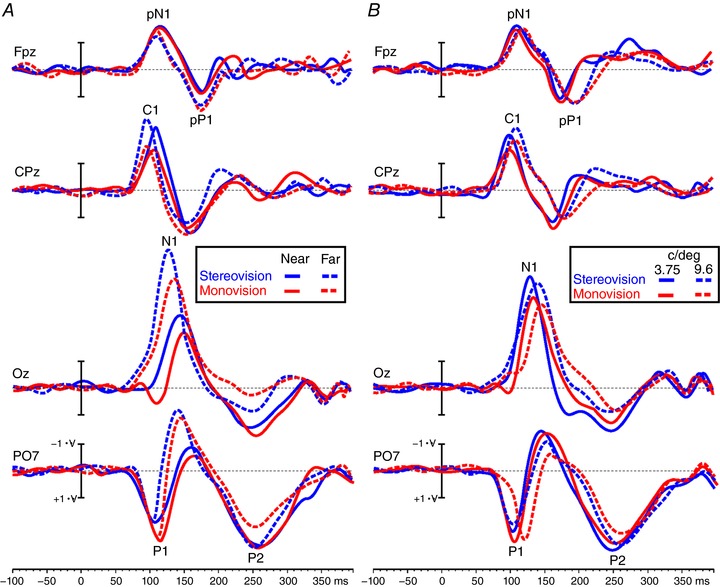
Grand‐averaged waveforms of the VEP from stereovision (blue lines) and monovision (red lines) conditions reported separately for the viewing distance (A) and spatial frequency (B). For viewing distance, the continuous lines represent the near distance, whereas the dotted lines represent the far distance. For spatial frequency, the continuous lines represent the low spatial frequency (3.75 cycle deg−1) and the dotted lines represent the high spatial frequency (9.6 cycle deg−1). The waveforms are displayed on the most relevant site: medial prefrontal (Fpz), medial central‐parietal (CPz), medial occipital (Oz) and parietal‐occipital (PO7). The considered components are labelled and time zero represents stimulus onset. [Color figure can be viewed at wileyonlinelibrary.com]