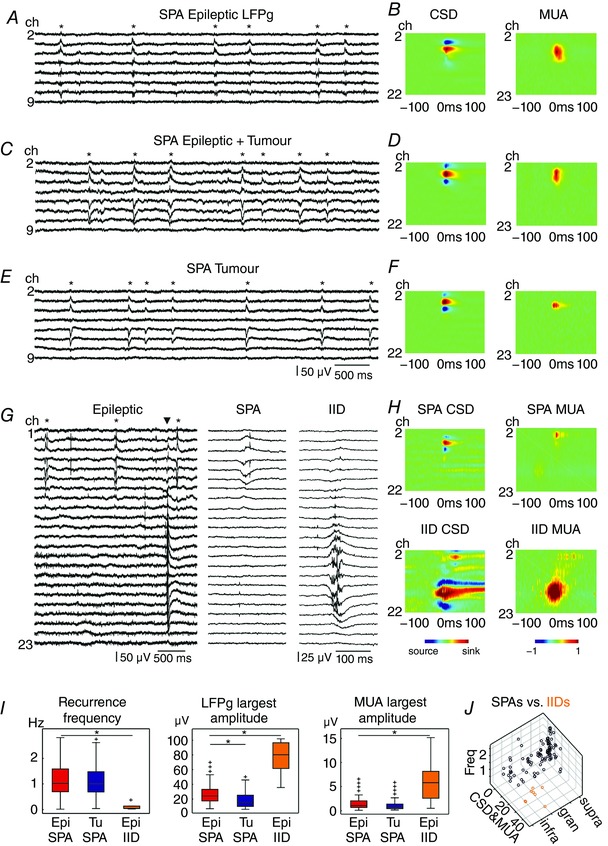
Figure 1. Network characteristics of SPAs in human neocortical slices.

SPAs were observed in tissue from epileptic patients without tumour (A and B), epileptic patients with tumour (C and D) and tumour patients without epilepsy (E and F). Furthermore, IID was detected in the epileptic neocortex (G and H). Left panels show LFPg traces from eight (A, C and E) channels positioned in the supragranular layers, while G shows 23 channels covering the entire width of the neocortex, with simultaneously occurring SPA and IID. Asterisks label SPA events (A, C, E and G); the triangle (G) indicates the IID event. One SPA and IID event each is magnified on the right side (G). Colour maps (B, D, F and H) show the CSD and the change in MUA. In most SPA cases CSD consisted of a pair or triple of simultaneous sinks and sources and was similar in all three patient groups. Warm colours depict sinks, while cold colours indicate sources. MUA increase was detected during SPAs and IIDs in almost all cases. Warm colours show MUA increase, cold colours label MUA decrease. Note the higher amplitude of CSD and MUA in case of IIDs (colour scales are the same for all heat maps). I, the recurrence frequency and the MUA were similar for SPAs of epileptic and tumour patients. The LFPg amplitudes were significantly larger for SPAs in epileptic patients than in tumour patients (LFPg: P < 0.01). All of these network characteristics of IIDs were significantly different from SPAs detected in epileptic tissue (P < 0.01). *Significant difference. J, the values of recurrence frequency (Freq), the average of CSD and MUA (CSD&MUA), and the intracortical location of all SPAs (black circles) and IIDs (orange circles) from epileptic and tumour tissue are shown on a three‐dimensional plot. Epi, epileptic; Tu, tumour; supra, supragranular; gran, granular; infra, infragranular. [Color figure can be viewed at wileyonlinelibrary.com]
