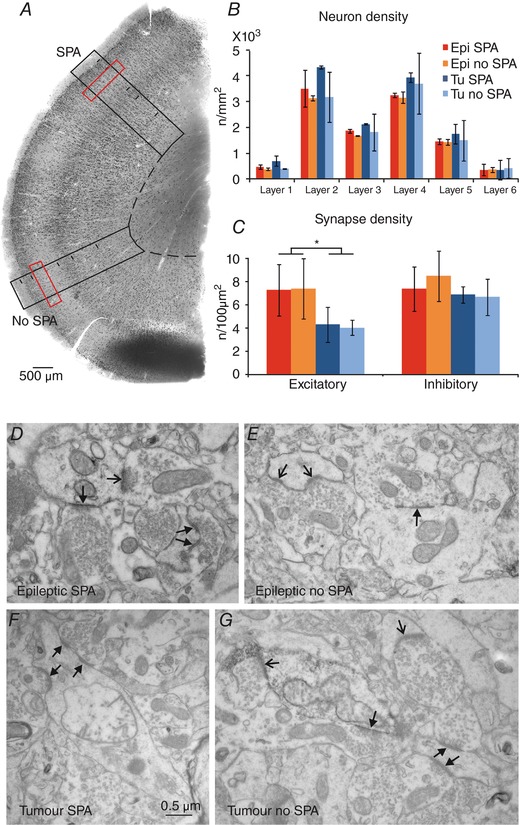
Figure 5. Anatomical data related to SPA generation.

Neuron and synapse counting was performed on NeuN‐stained sections (A). Neuron density (B, black boxes on A) and synapse density (C, red boxes on A) were determined in areas where SPA was recorded and in areas of the same slice where SPA could not be detected. B, neuronal densities (n/mm2) were variable in the different layers of the neocortex of epileptic and tumour patients. Neuron density was lower in epileptic than in tumour tissue, and it was slightly higher in regions with SPA than in areas lacking SPA. C, density of asymmetrical (excitatory) and symmetrical (inhibitory) synapses (n/100 μm2) in epileptic and tumour tissue. No difference was found between areas with or without SPA. The density of excitatory synapses was higher in epileptic than in tumour tissue (P < 0.001). D–G, electron micrographs show asymmetrical (thin‐headed arrows) and symmetrical (triangular‐headed arrows) synapses from epileptic (D and E) and tumour (F and G) tissue, from areas with SPA (D and F) or without SPA (E and G). [Color figure can be viewed at wileyonlinelibrary.com]
