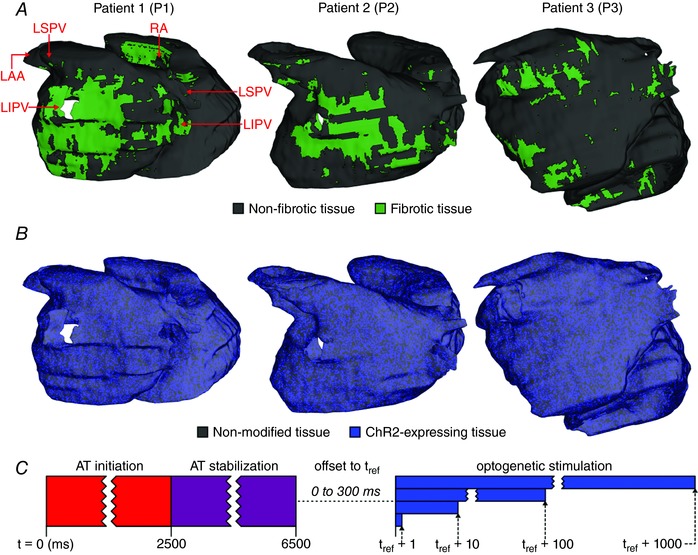
Figure 1. Simulation methodology.

A, 3D renderings of models reconstructed from LGE‐MRI scans including patient‐specific distribution of fibrotic and non‐fibrotic tissue. Models are shown by a posterior view of the LA; key anatomical landmarks are indicated. B, maps showing distribution of ChR2‐expressing tissue. C, schematic diagram summarizing protocol used to assess feasibility of optogenetic AT termination in each model. See Methods for full details. [Color figure can be viewed at wileyonlinelibrary.com]
