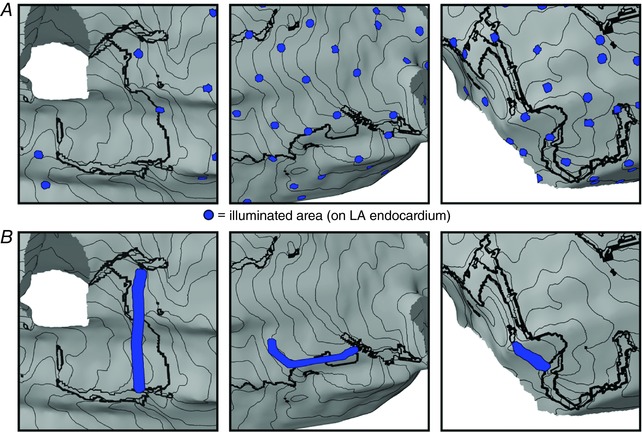
Figure 3. Distributed and targeted illumination schemes.

A, maps showing directly illuminated LA endocardial areas for examples of distributed optogenetic stimuli with 64, 128 and 256 optrodes (left, middle and right, respectively). B, same as A but for targeted optogenetic stimuli customized to target regions identified by min‐cut analysis, as described in Methods. In both panels, views and isochrones lines are the same as in inset panels of Fig. 2. [Color figure can be viewed at wileyonlinelibrary.com]
