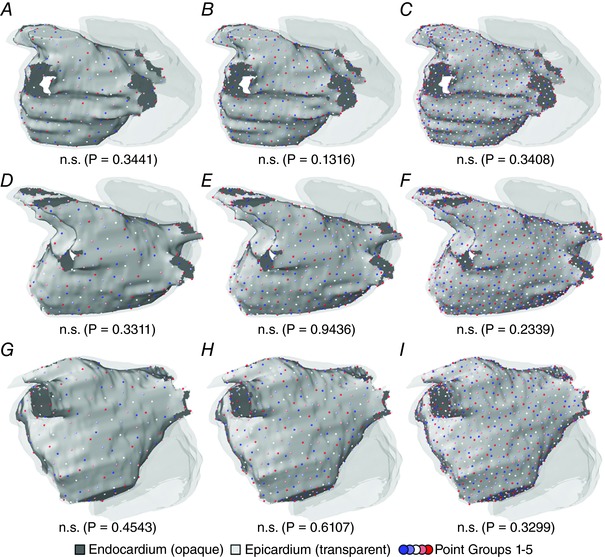
Figure 4. Spatially distributed optrode distributions.

LA endocardium is rendered in opaque grey; other cardiac surfaces are translucent. Each panel shows the five disjoint spatial patterns used for each optrode density in one patient model; different sets are represented by different colours. The value shown beneath each panel is the result of a statistical test used to ascertain whether inter‐point spacing was uneven (Kruskal–Wallis). A–C, distributions with 64, 128 and 256 evenly spaced optrodes, respectively, for the P1 model. D–F, same as A–C but for P2. G–I, same as A–C but for P3. [Color figure can be viewed at wileyonlinelibrary.com]
