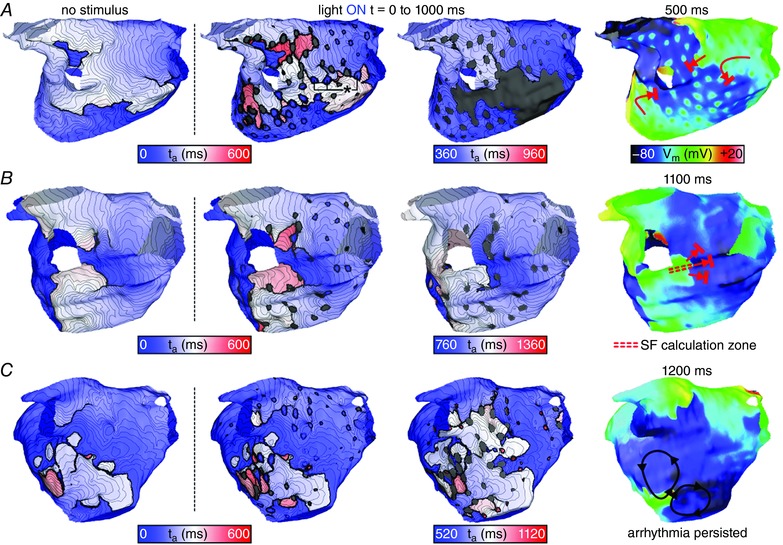
Figure 5. Response to illumination via three distributed optrode configurations.

Maps are rendered exclusively on the LA endocardial surface (epicardial surfaces not shown). t a = 0 corresponds to the instant of stimulus onset (regardless of pulse timing). Column 1 shows the excitation sequence that would have occurred in the absence of stimulation; columns 2–4 show the response to illumination and subsequent propagating activity via maps of both ta and V m. Red arrows show wavefront propagation and conduction block for cases where stimulation terminated AT; black arrows show persistent re‐entrant activity following light pulses that failed to terminate AT. A, result of a 1000 ms‐long pulse applied by a 256‐optrode array in the P2 model; classified as rapid termination (see text). *indicates new excitations induced directly by the optogenetic stimulus that were located near the target identified by min‐cut analysis. B, same as A but for illumination with a 128‐optrode array in P1, leading to delayed termination (see text). Double‐dashed red lines indicate pathway along which SF was calculated (see text and Fig. 6). C, same as A but for illumination with a 256‐optrode array in the P3 model, which failed to disrupt AT. Supplementary Videos 4–6 show the spatiotemporal evolution of V m on the endocardium and epicardium for simulations corresponding to panels A–C, respectively. [Color figure can be viewed at wileyonlinelibrary.com]
