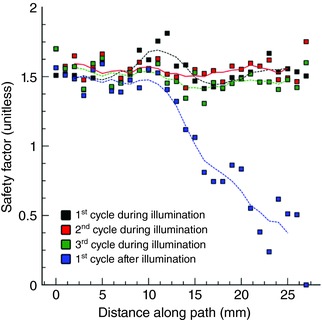
Figure 6. Safety factor (SF) of cardiac conduction.

Different‐coloured squares indicate SF values at nodes along the red‐highlighted pathway in Fig. 5 B for three consecutive cycles of AT that persisted during application of a 1000 ms‐long optogenetic stimulus and the subsequent cycle, during which AT terminated via conduction block that occurred in the analysed region. Propagation during AT was robust (i.e. no SF values <1.25 were observed) but quickly deteriorated towards critical values (SF ≤ 1) on the first cycle after the light stimulus was turned off. Dashed lines show the result of applying a five‐point moving average filter to the SF values. [Color figure can be viewed at wileyonlinelibrary.com]
