Figure 3.

Association analysis.
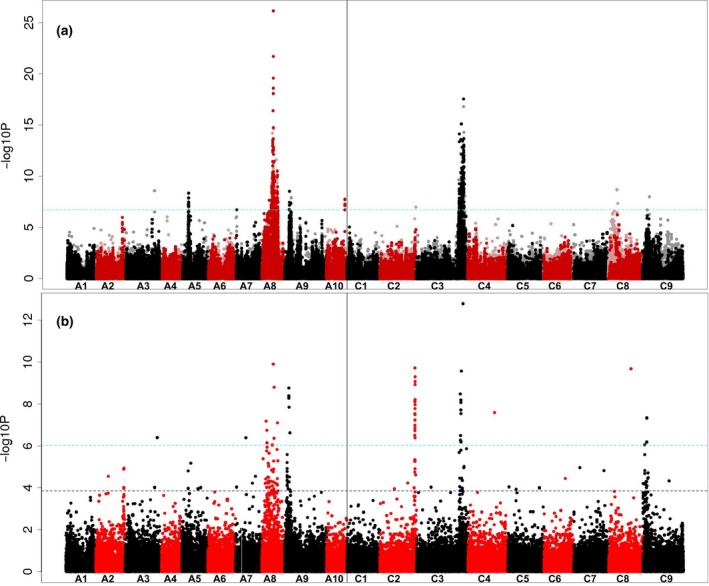
(a) Transcriptome single‐nucleotide polymorphism (SNP) markers with seed erucic acid content. The SNP markers are positioned on the x‐axis based on the genomic order of the gene models in which the polymorphism was scored, with the significance of the trait association, as –log10P, plotted on the y‐axis. A1–A10 and C1–C9 are the chromosomes of Brassica napus, shown in alternating black and red colours to permit boundaries to be distinguished. Hemi‐SNP markers (i.e. polymorphisms involving multiple bases called at the SNP position in one allele of the polymorphism) for which the genome of the polymorphism cannot be assigned are shown as light points, whereas simple SNP markers (i.e. polymorphisms between resolved bases) and hemi‐SNPs that have been directly linkage‐mapped, both of which can be assigned to a genome, are shown as dark points. The broken light‐blue horizontal line marks the Bonferroni‐corrected significance threshold of 0.05.
(b) Transcript abundance with seed erucic acid content. The gene models are positioned on the x‐axis based on their genomic order, with the significance of the trait association, as –log10P, plotted on the y‐axis. The broken dark‐blue horizontal line marks the 5% false discovery rate.
