
Figure 1.
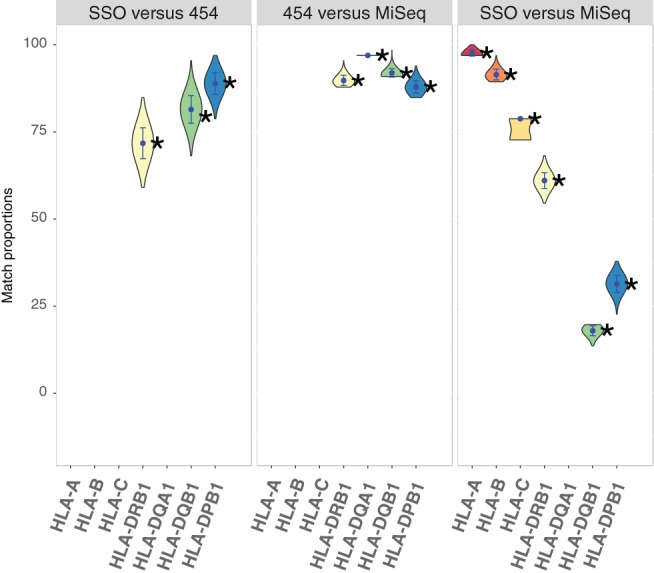
Proportions of genotype matches (or « matching scores ») obtained between PCR‐SSO (“SSO” in the Figure), NGS‐454 (“454”) and NGS‐MiSeq (“MiSeq”) at 3 to 6 HLA loci (DQA1 was not typed with PCR‐SSO and class I genes were not typed with NGS‐454). For the comparisons involving NGS‐454, as the sequences obtained with this technique were limited to exon 2 and may thus correspond to different alleles, we reported a match when the allele found with the other technique was compatible with the NGS‐454 sequence. Only perfect matches (i.e. for any compared genotype, when both alleles found with the 2 techniques were either compatible or identical) were counted. The comparisons were replicated 1′000 times each on random samples of 66 individuals (corresponding to the lowest sample size of the observed data) drawn without replacement to assess the variability of genotype matches due to sampling size