
Figure 2.
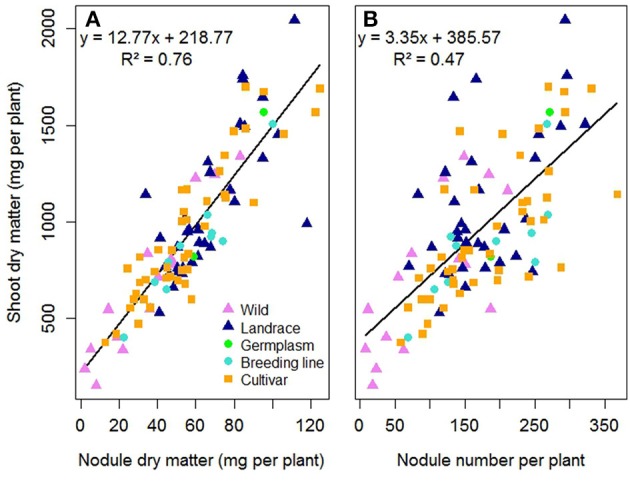
Relationship between shoot dry matter and (A) nodule dry matter or (B) nodule number per plant, for 104 pea accessions multi-inoculated with a mixture of five Rlv strains (E1 experiment). Each point represents mean values for one pea accession measured 4 weeks after sowing. Symbols are different and colored according to cultivation status. Lines and equations represent linear regression results (both P < 0.001).