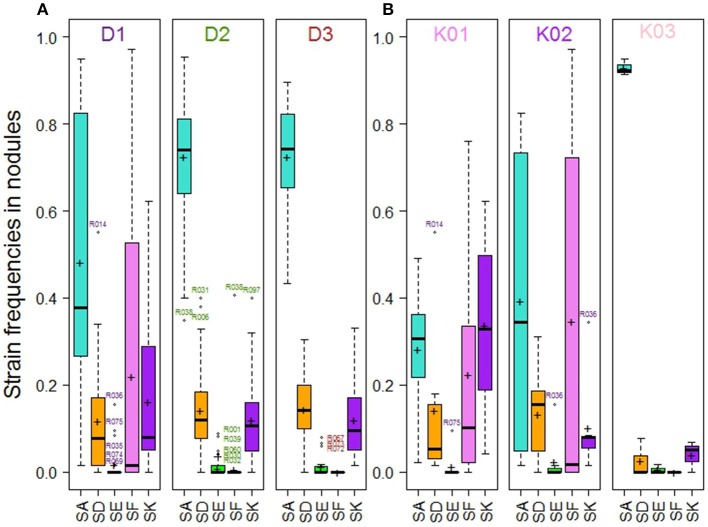
Figure 4.
Strain frequencies in the nodules of pea accessions multi-inoculated with a mixture of five Rlv strains (E1 experiment), (A) within the 104 pea accessions according to their membership to DAPC groups, (B) within the subset of pea accessions belonging to D1 according to their membership to K01, K02 or K03 clusters. Crosses and bold lines respectively indicate mean frequency values and medians. Open circles represent outliers identified by accession numbers.

