
Figure 5.
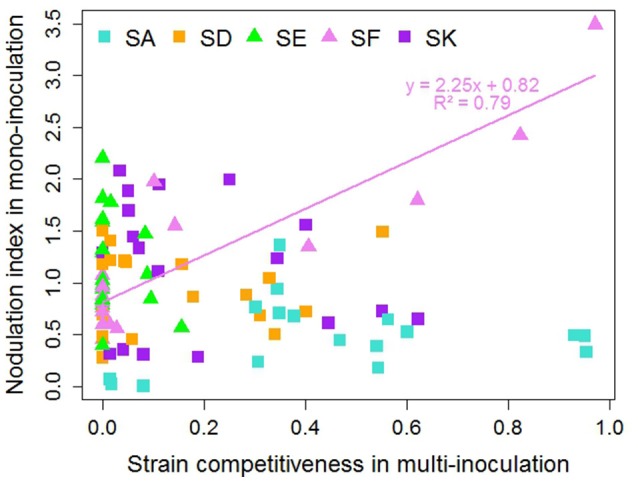
Relationship between nodulation index in mono-inoculation (E2 experiment) and strain competitiveness for nodulation in multi-inoculation (E1 experiment) for 18 contrasted pea accessions. Squares represent European strains. Line and equation represent significant linear regression results (P < 0.001).