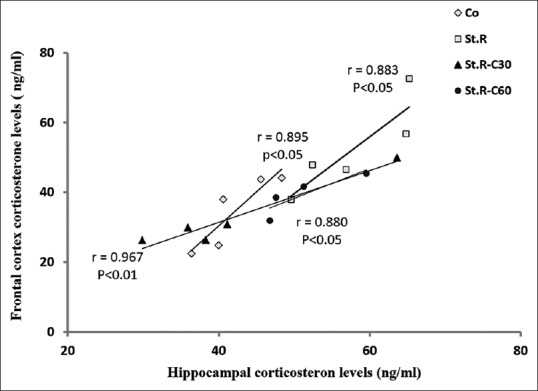
Figure 6.

Correlation analysis of the frontal cortex and hippocampal corticosterone levels in the different groups (n = 8). Results are expressed as means ± standard error of mean (Pearson's correlation t-test). A significant (P < 0.05) and positive correlation was established between the frontal cortex corticosterone levels and those of the hippocampus in all the groups examined. Co: Control group, Sh: Sham group, St.R: Restrain stress group, St.R-C30: Restrain stress-Crocin 30 group, St.R-C60: Restrain stress-Crocin 60 group
