Figure 3.

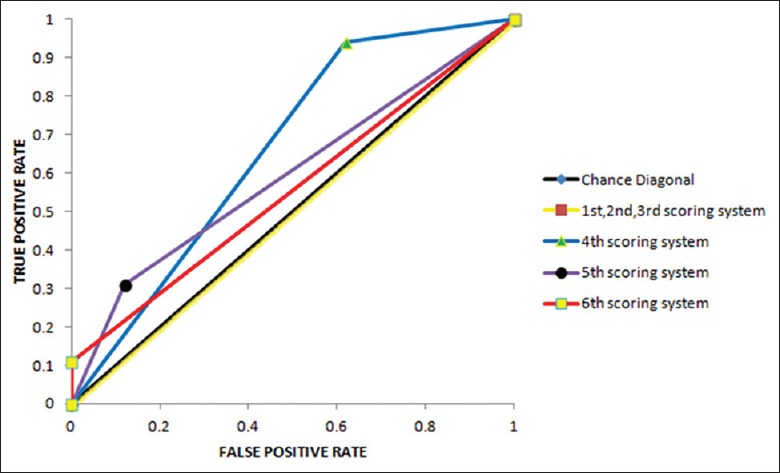
Receiver operating characteristic curves plotted for the 6 scoring systems (evaluator 1). The plotting of data for for 1st, 2nd, 3rd scoring systems reveals that the ROC curves coincides on chance diagonals and bears no significance

Receiver operating characteristic curves plotted for the 6 scoring systems (evaluator 1). The plotting of data for for 1st, 2nd, 3rd scoring systems reveals that the ROC curves coincides on chance diagonals and bears no significance