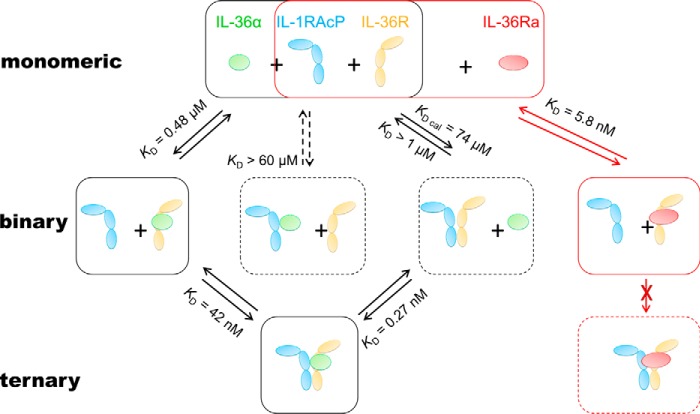
Figure 1.
A schematic diagram of binding events involved in IL-36 activation and inhibition. This illustration shows that among the three possible activating binary complexes, IL-36α·IL-36R is the most likely to form because of its stronger interactions when comparing to the other two. IL-1RAcP is recruited to IL-36α·IL-36R at a KD of 42 nm for ternary complex formation. IL-36Ra, when present, competes with IL-36α for IL-36R binding. The KD values are averages of at least two independent SPR binding results. Solid boxes represent likely bound or unbound states of receptors, co-receptors, and cytokines in cells. Dashed boxes represent either the unlikely state or a transient state. Activation paths are illustrated with black arrows and boxes, whereas the inhibition path is shown in red.

