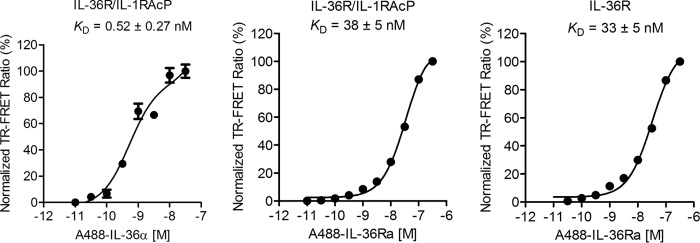
Figure 6.
IL-36α and IL-36Ra bind to IL-36R and heterodimer in solution by TR–FRET. IL-36α (left panel) binds to Fc-linked IL-36R·IL-1RAcP heterodimer strongly in solution. IL-36Ra binds to heterodimer (middle panel) and IL-36R (right panel) with similar affinities. The ratio of fluorescent signal at 520 and 495 nm is normalized to the maximal signal ratio. Averages of triplicate measurements are shown in the plot. Standard deviations are represented as error bars. The data are fit using Equation 3 to obtain KD.

