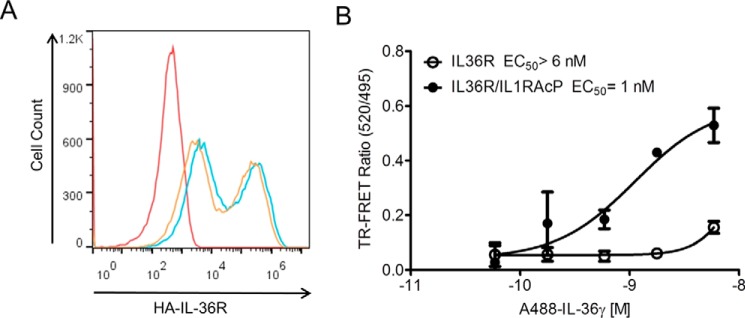
Figure 7.
IL-36γ binds to IL-36R and heterodimer expressed on HEK293 cells by glyco-FRET. A, IL-36R surface expression analysis on expanded IL-36R and IL-36R·IL-1RAcP HEK 293H cell lines with FACS using anti-HA antibody described under “Experimental Procedures.” The Geo mean values of fluorescence are 2.3 × 10⁴, 1.5 × 10⁴, and 2.2 × 10² for IL-36R (blue), IL-36R·IL-1RAcP (orange), and parental HEK293H (red), respectively. B, glycol-FRET analysis on HEK293 cells overexpressing IL-36R or IL-36R·IL-1RAcP shows strong binding of IL-36γ to receptor dimer but not the monomer. The ratio of fluorescent signal at 520 and 495 nm is shown (TR–FRET ratio). Averages of triplicate measurements are shown in the plot. Standard deviations are represented as error bars.

