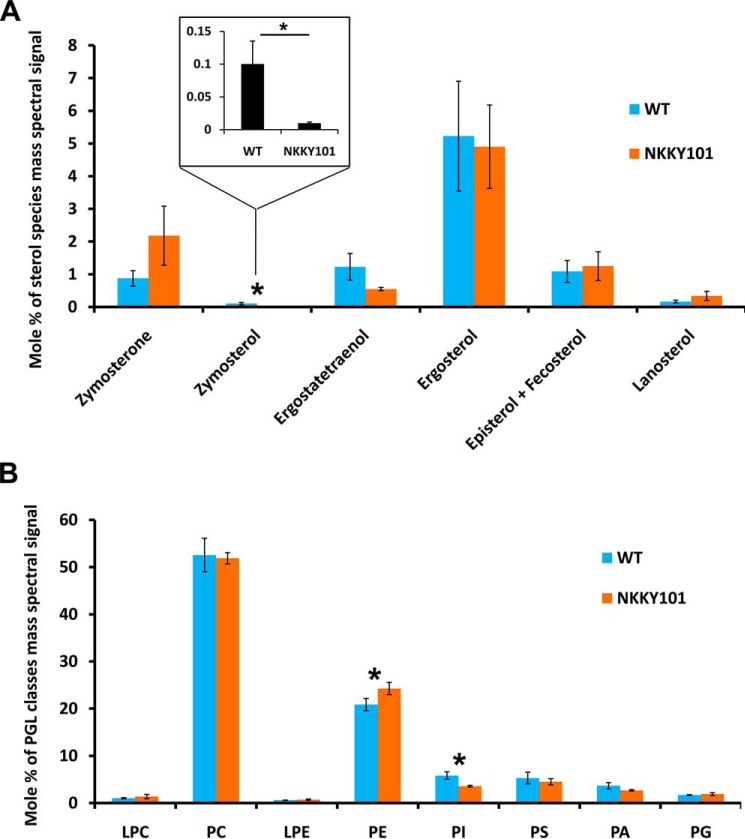
Figure 5.
Lipid profile of CDR6/ROA1 null NKKY101 mutant as compared with WT. A, sterol species level in WT and NKKY101 strain; data represent the percentage of total sterol mass spectral signal after normalization to internal standards. B, levels of PGL classes in WT and NKKY101 strain; the data represent the percentage of total PGL mass spectral signal after normalization to internal standards. Experiments were performed in biological quadruplet, and results are shown as means ± S.E. (error bars). A statistical significance value of p ≤ 0.05 (*) was calculated using Student's t test. The raw data for the graphs are available as Table S1. LPC, lysophosphatidylcholine; PC, phosphatidylcholine; LPE, lysophosphatidylethanolamine; PS, phosphatidylserine; PI, phosphatidylinositol; PA, phosphatidic acid; PG, phosphatidylglycerol.

