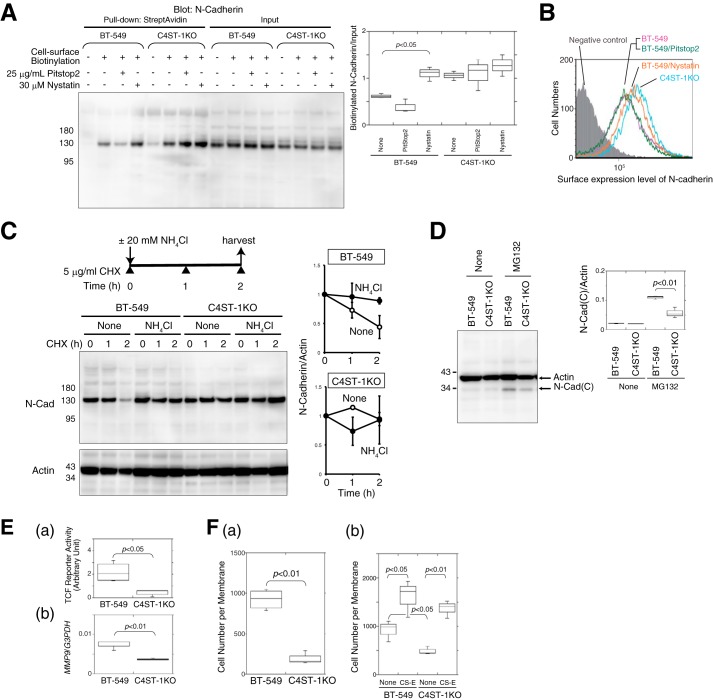
Figure 9.
CSs synthesized by C4ST-1 controlled endocytosis of N-cadherin, cleavage of N-cadherin, β-catenin signaling, and cell invasive activity in BT-549 cells. A, after BT-549 and C4ST-1KO cells were treated with or without Pitstop2 or nystatin for 2 h, the cell-surface proteins were labeled with Ez-Link sulfo-NHS-Biotin (2nd to 4th, 6th to 8th, 10th to 12th, and 14th to 16th lanes), which was followed by a pulldown assay using StreptAvidin-agarose beads. The pulldown complex was analyzed by immunoblotting using anti-N-cadherin. The box-and-whisker graph at right indicates the cell-surface expression level of N-cadherin, normalized against the total expression level of N-cadherin (input), in BT-549 and C4ST-1KO cells (n = 3). Statistical significance was assessed using a Student's t test. B, surface N-cadherin expression on BT-549 cells (magenta), BT-549 cells treated with Nystatin (orange) or with Pitstop2 (green), and on C4ST-1KO cells (cyan) were compared by FACS analysis. The shaded area indicates cells treated without anti-N-cadherin antibody (negative control). C, disappearance rate of the full-length N-cadherin in BT-549 and C4ST-1KO cells during a cycloheximide chase in the presence or absence of an inhibitor of endocytosis, NH4Cl, was analyzed by Western blotting. In the graph at right the presence or absence of NH4Cl is indicated by closed and open circles, respectively. Two independent experiments were carried out for each data set. Error bars represent standard deviation (S.D.). D, amount of the C-terminal fragment, N-Cad(C), generated in BT-549 and C4ST-1KO cells in the presence or absence of 10 μm MG132 was analyzed by Western blotting. In the graph at right, the quantified expression level of N-Cad(C) was compared between BT-549 and C4ST-1 cells. Three independent experiments were carried out for each data set. E, panel a, activation level of β-catenin signaling in BT-549 and C4ST-1KO cells was estimated using the TCF reporter vector (n = 3). Panel b, gene expression level of MMP9 in BT-549 and C4ST-1KO cells was examined using real-time PCR (n = 3). F, panel a and b, invasive activity of BT-549 and C4ST-1KO cells was measured in a Matrigel invasion assay in the absence or presence of CS-E (n = 3).

