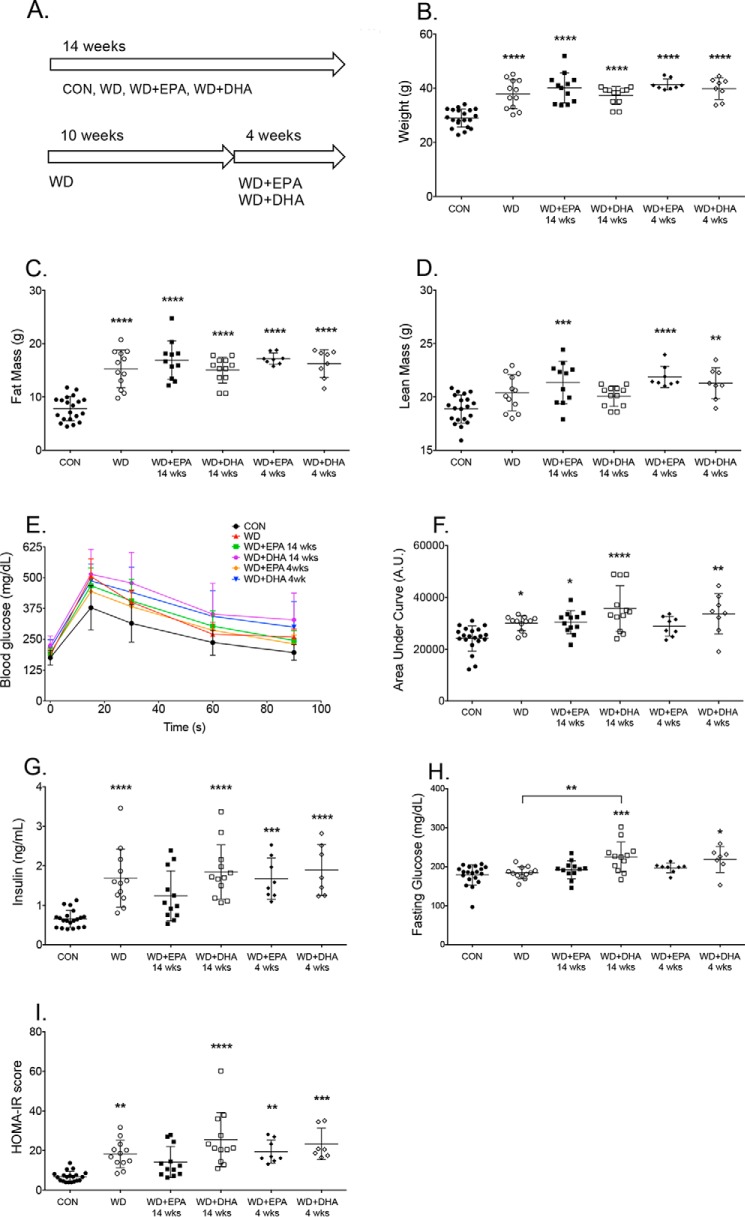
Figure 2.
Metabolic profile of mice consuming a Western diet in the absence or presence of EPA and DHA for differing time points. A, schematic of the diet feeding schedule for mice consuming the control (CON), Western diet (WD), and Western diet containing EPA or DHA ethyl esters. B, body weights at the end of the 14-week feeding period. Fat (C) and lean (D) mass was determined by Echo-MRI. E, whole-body glucose tolerance test was performed by intraperitoneal injection of glucose after a 5-h fast. F, AUC, calculated by integration of the raw glucose tolerance test curves shown in E. G, fasting insulin; H, fasting glucose levels. I, homeostasis model assessment for insulin resistance (HOMA-IR) index scores. Data are the average ± S.D. from 8 to 20 independent experiments. Asterisks indicate significance from control (CON) (*, p < 0.05; **, p < 0.01; ***, p < 0.001; ****, p < 0.0001). Horizontal bars with asterisks indicate significance between treatments. For simplicity, statistical significance is not indicated between time points (14 and 4 weeks).

