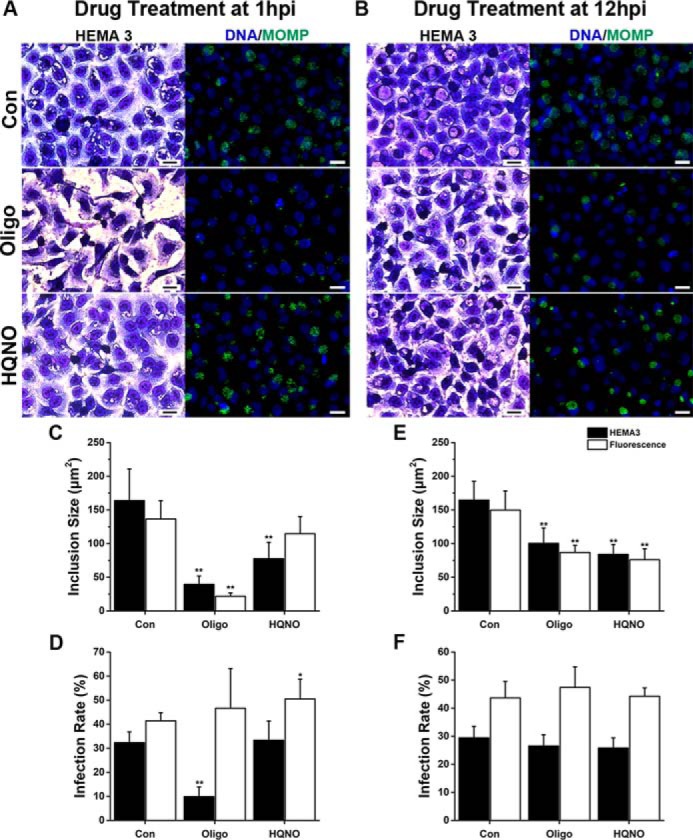
Figure 4.

Effect of respiratory chain inhibitors on chlamydial infection in cell culture. A and B, representative images of C. trachomatis–infected HeLa cultures treated with 10 μm oligomycin A (Oligo) or 10 μm HQNO, at 1 or 12 hpi, and stained with HEMA 3 staining or immunofluorescence with anti-MOMP antibodies (green) at 36 hpi. In the fluorescent images, DNA is visualized with Hoechst 33342 (blue). Scale bars represent 20 μm. C and E, size of the chlamydial inclusion was quantified by measuring the area of the inclusions with the inhibitors added at 1 hpi (C) or 12 hpi (E). 110–340 inclusions were measured per condition per experiment using ImageJ. D and F, chlamydial infection rate was determined by quantifying the percentage of inclusion-positive cells with the inhibitors added at 1 hpi (D) or 12 hpi (F). More than 200 cells were quantified per condition per sample. Results were collected from 6 to 8 separate experiments and are expressed as mean ± S.D. Asterisks denote the significance from the vehicle-treated control (Con). *, p < 0.05; **, p < 0.005.
