Figure 4.
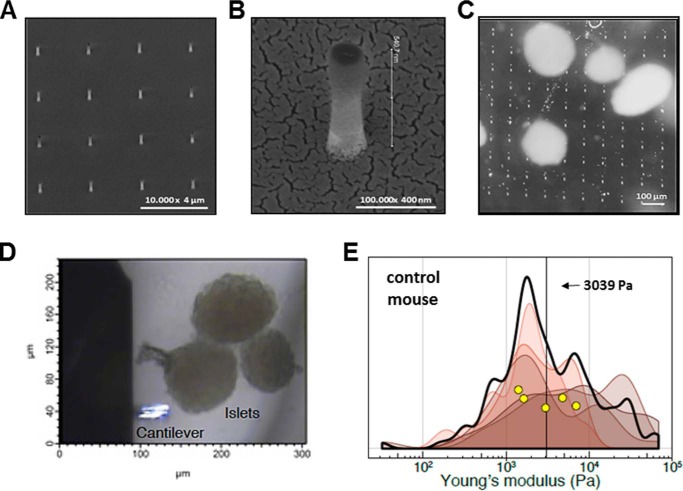
Islets measured by AFM were anchored by impaling them. A and B, representative electron microscopy of glass cylindrical nanopillars. The nanopillars arose from a glass base and were measured to be ∼1000 nm tall, 200 nm in diameter, and spaced by 3 μm center to center. C, freshly isolated islets from mice were transferred onto the nanopillars. The individual nanopillars were not visible here, but 5-μm-square fiducials placed periodically with the array of pillars are seen. D, bright-field images of AFM cantilever (lower left) and three islets anchored on the nanopillar array (not visible in this focal plane) to be scanned. E, five independent islets from control mice were measured on average 28 discrete points each. Elastic moduli calculated from these indentations are graphed as a smoothed histogram; each shade represents a different islet. The black curve indicates the sum distribution. Yellow circles are the mean stiffness for each islet. The vertical black line at 3039 Pa is the average.

