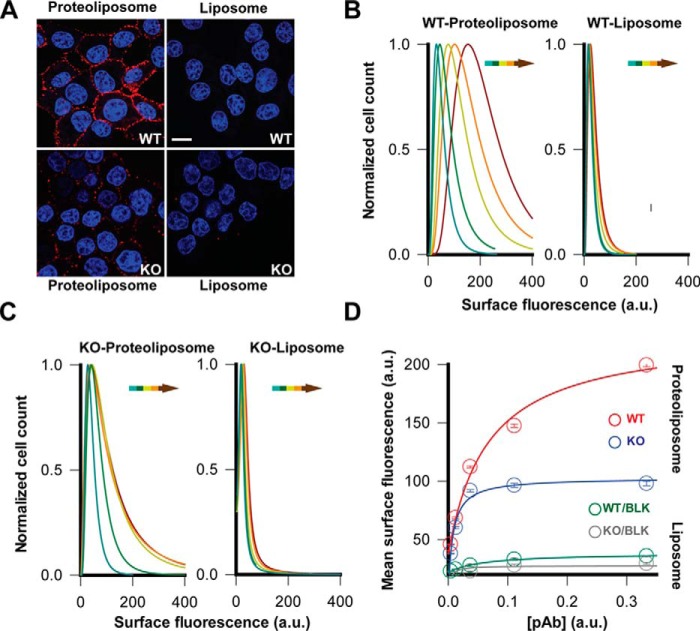
Figure 4.
ZnT8-specific surface labeling of live INS-1E cells. A, representative confocal images of immunofluorescence staining of WT or ZnT8 KO cells using a proteoliposome- or liposome-immunized serum as indicated. Scale bar, 20 μm. B, histograms of surface immunofluorescence intensities measured in >10,000 WT INS-1E cells that were stained by a proteoliposome- and liposome-immunized serum as indicated. The solid lines are least square fits to a Lorentzian distribution. Arrows indicate serum titrations with increasing concentrations. C, identical experiments in B except that ZnT8 KO INS-1E cells were used. D, saturation of surface immunofluorescence staining with increasing serum concentrations. The concentration-intensity relationships were plotted using flow cytometry data in B and C (mean intensity ± S.E.). The solid lines are hyperbolic fits of concentration-dependent surface staining with a proteoliposome- or liposome-immunized serum as indicated.

