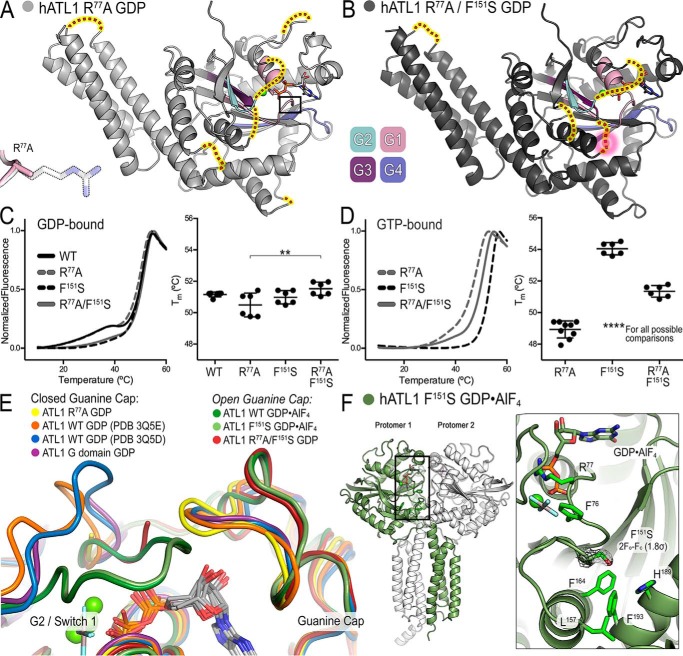
Figure 5.
Structures of ATL1 mutants have diverse dimerization capacities and guanine cap configuration. A, ATL1-R77A bound to GDP·Mg2+ (light gray) exists in a monomeric state with G and middle domains engaged. Switch regions (G1 (pink), G2 (teal), G3 (dark purple), and G4 (blue/purple)) are largely disordered, and their hypothetical locations are indicated (red dots highlighted yellow). Inset, α-carbon backbone of loop containing R77A and the β-carbon of residue 77 are not perturbed. B, ATL1-R77A/F151S bound to GDP·Mg2+ (dark gray) also exists in a monomeric state with G and middle domains engaged. Switch regions, colored as in A, are more ordered than in the isomorphic ATL1-R77A structure, and their hypothetical locations are indicated (red dots highlighted yellow). The F151S mutation is part of the G3 switch region and is disordered in this structure; hypothetical location of the mutation is outlined by a pink halo. C, thermal melting data for wild-type ATL1, ATL1-R77A, ATL1-F151S, and ATL1-R77A/F151S bound to GDP. The Tm associated with the major unfolding phase is significantly different for ATL1-R77A and ATL1-R77A/F151S (**, p ≤ 0.01). D, thermal melting data for ATL1-R77A, ATL1-F151S, and ATL1-R77A/F151S bound to GTP. A single unfolding phase exhibits very different Tm values for the three mutant proteins (****, p ≤ 0.0001 for all possible comparisons). E, the indicated crystal structures were aligned using the G domain as a reference to observe the conformation of the guanine cap. The ATL1-R77A structure (yellow) had this loop closed onto the guanine base like other GDP·Mg2+-bound structures (orange, blue, and purple). However, both the ATL1-R77A/F151S GDP-bound (red) and the ATL1 -F151S GDP·AlF4−-bound (light green) structures mirror the wild-type transition-state structure (dark green) and have a retracted guanine cap. F, ATL1-F151S bound to GDP·AlF4− (protomer 1 (green) and protomer 2 (white)) is fully capable of equilibrating into the high-affinity transition state despite the F151S mutation being buried within the core of the enzyme. 2Fo − Fc map for the F151S mutation contoured to 1.8σ is depicted in black mesh. In C and D, melting curves showing means and Tm values showing means ± S.D. (error bars) are plotted from two biological replicates with a minimum of three technical repeats each.

