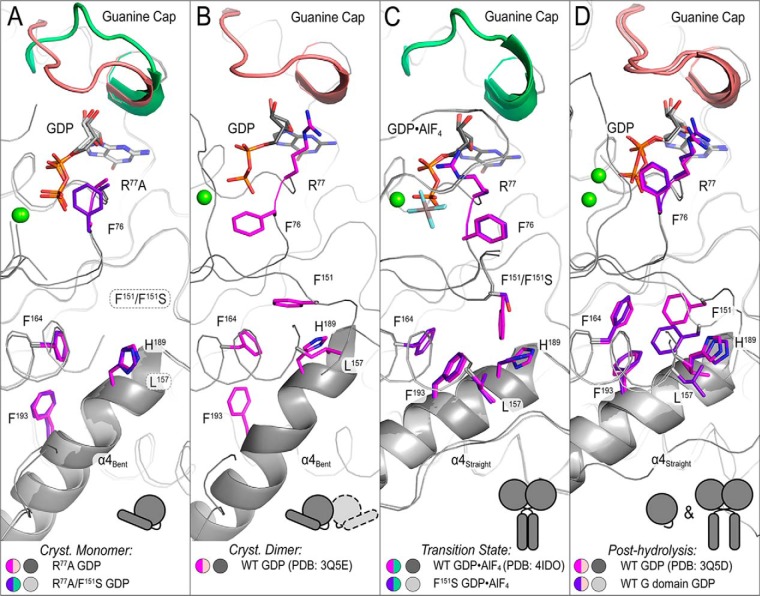
Figure 6.
Structure-based model for a hydrophobic interaction network that establishes interdomain allostery. Hydrophobic residues connect the active site (GDP (white/black) and guanine cap (green/salmon)) to helix α4 (schematic helix). A, structures depicting crystallographic monomers (ATL1-R77A (pink/dark gray) and ATL1-R77A/F151S (purple/light gray)) are flexible with Phe76 (in ATL1-R77A structure), F151S, and Leu157 being disordered and helix α4 bent. B, when switch regions are stabilized via homotypic crystallographic dimer contacts, the G/middle domain-engaged structure (PDB code 3Q5E, pink/dark gray) shows Phe76 rotating away from the nucleotide and Phe151 being resolved. C, both wild-type (PDB code 4IDO, pink/dark gray) and ATL1-F151S (purple/light gray) transition-state structures exhibit a switch reorganization that is accompanied with a downward rotation of Phe151 that pushes against His189 and Leu157. The helix α4 becomes straight, and Phe193, which is located at the helix's bend and may contribute energetically to helix straightening, rotates to form hydrophobic interactions with other residues labeled in this panel. D, structures resembling the post-hydrolysis state (PDB code 3Q5D (pink/dark gray) and isolated G domain (purple/light gray)) exhibit a configuration that is en route to resetting the cycle. The helix α4 remains straight, and upstream residues (Phe76 and Phe193) begin to take on conformations seen in A.

