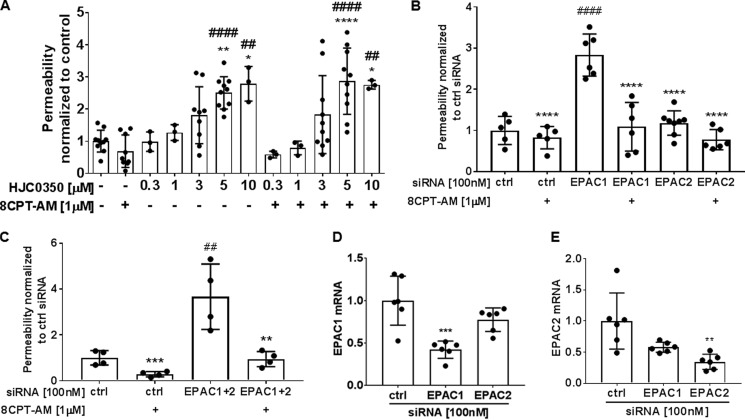
Figure 6.
EPAC contributes to basal barrier properties in BREC. A, solute flux assay was used to test EPAC antagonist, HJC0350, at different concentrations on BREC. HJC0350 5 to 10 μm had a significant increase in basal permeability and blocked 8-CPT-AM barrier induction. Average Po values for control and HJC0350 were 2.2 × 10⁻⁷ and 4.4 × 10⁻⁷ (cm/s). Results are expressed as the mean ± S.D. relative to the control with a total of n ≥ 3, ####, p < 0.0001 or ##, p < 0.001 compared with control or scramble control in B and C and ****, p < 0.0001; ***, p < 0.001; **, p < 0.01; *, p < 0.05 compared with 8-CPT-AM or siRNA EPAC1 in B or siRNA EPAC1 and EPAC2 in C. B, solute flux assay was used to test permeability in BREC with either EPAC1 or EPAC2 knockdown. Scramble (ctrl), EPAC1 and EPAC2 siRNA at 100 nm were used in BREC. Average Po values for scramble control, EPAC1 and EPAC2 siRNA were 1.1 × 10⁻⁷, 3.1 × 10⁻⁷, and 1.3 × 10⁻⁷ (cm/s). C, solute flux assay was used to test permeability in BREC with double knockdown of EPAC1 and EPAC2 in BREC. EPAC1 and EPAC2 siRNA were used at 100 nm. Average Po values for scramble control and double EPAC1 and 2 siRNA were 0.86 × 10⁻⁶ and 3.1 × 10⁻⁶ (cm/s). D, SYBR Green qRT-PCR was used to quantify EPAC1 and E, EPAC2 mRNA after siRNA knockdown.

