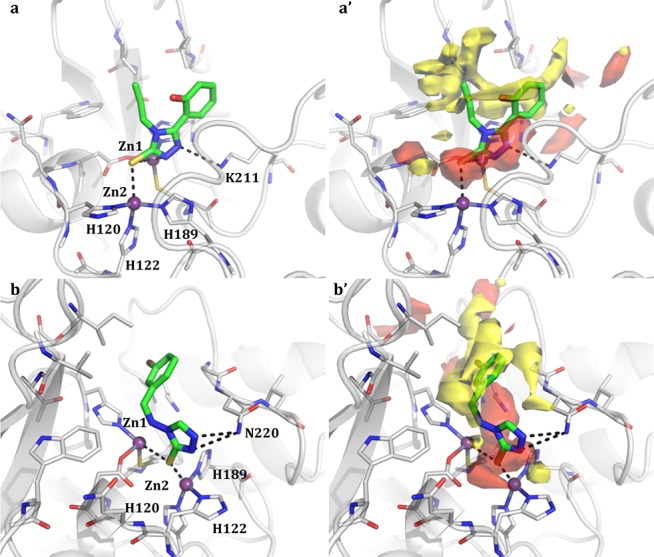
Figure 1.

Binding poses of compounds 1 and 2 in NDM-1 binding site (a and b, respectively). Compounds are shown as capped sticks, zinc ions as purple spheres, and H-bonds as dashed lines. The binding site Molecular Interaction Fields are shown in panels a′ and b′. For clarity, only the hydrophobic (yellow) and hydrogen-bond acceptor (red) contours are shown. Pictures were prepared using Pymol (http://www.pymol.org).
