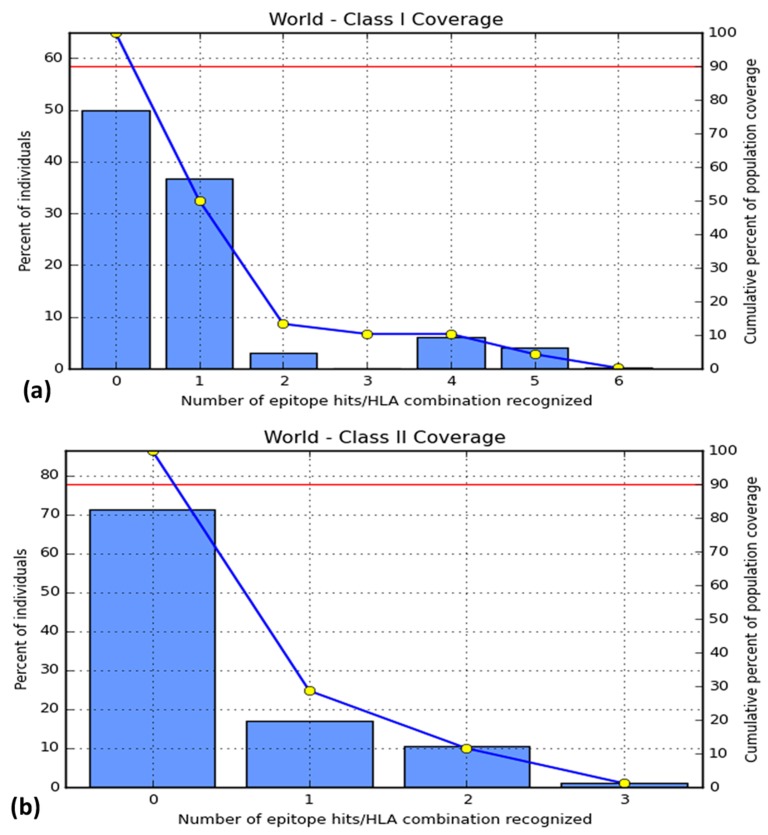
Figure 4.
Worldwide population coverage of (a) T-cell epitopes and (b) B-cell epitopes with MHC class I alleles and MHC class II alleles respectively. Bar '0' indicates the percentage of people not elucidating immune response by the epitopes. In the figures (a) and (b), bar '1' indicates the highest interaction showed by the epitopes 'LLGTFTWTL' and 'AELKCFGNTAVAKCNE' respectively.

