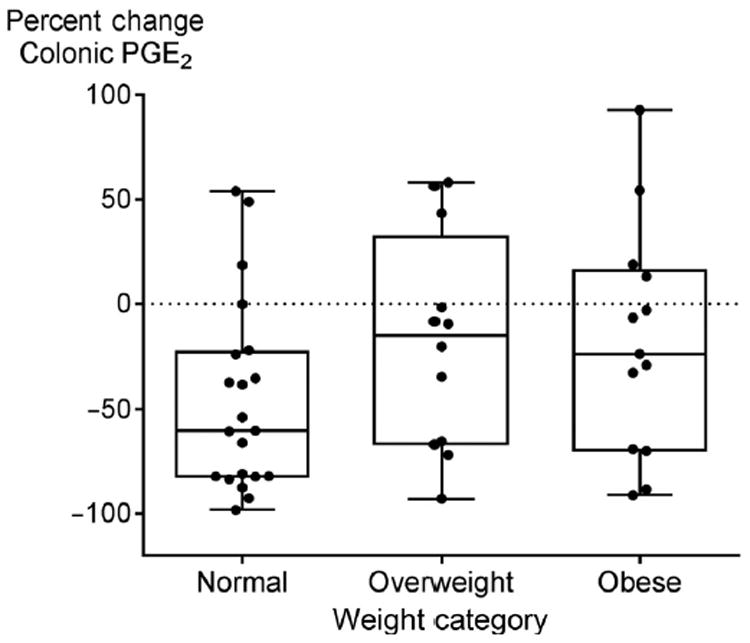
Figure 3.

Changes in colonic mucosal PGE2 concentrations by baseline obesity status with a BMI of <25 kg/m2 defined as normal weight, 25–29.9 kg/m2 as overweight, and >30 kg/m2 as obese. Change was calculated for each individual, and data shown are mean change for each body weight group. The box-and-whisker plots show the median indicated by the vertical bar in the middle, box edges indicate 25th to the 75th quartile, and the whiskers extend to the minimum and maximum points. The horizontal dotted line signifies no change (zero percent change) in colonic PGE2 after 12 weeks of target dosing relative to that at study entry. One outlier was excluded in the data shown, and this was an obese subject with a 194% increase in colonic PGE2. Values above the dotted line indicate an increase and values below the dotted line indicate a decrease in colonic PGE2. The mean doses of ω-3 fatty acids were 4.5 (SD, 1.6), 5.6 (SD, 2.4), and 6.6 (SD, 1.7) g/day in normal, overweight, and obese participant groups, respectively (P = 0.002 by one-way ANOVA).
