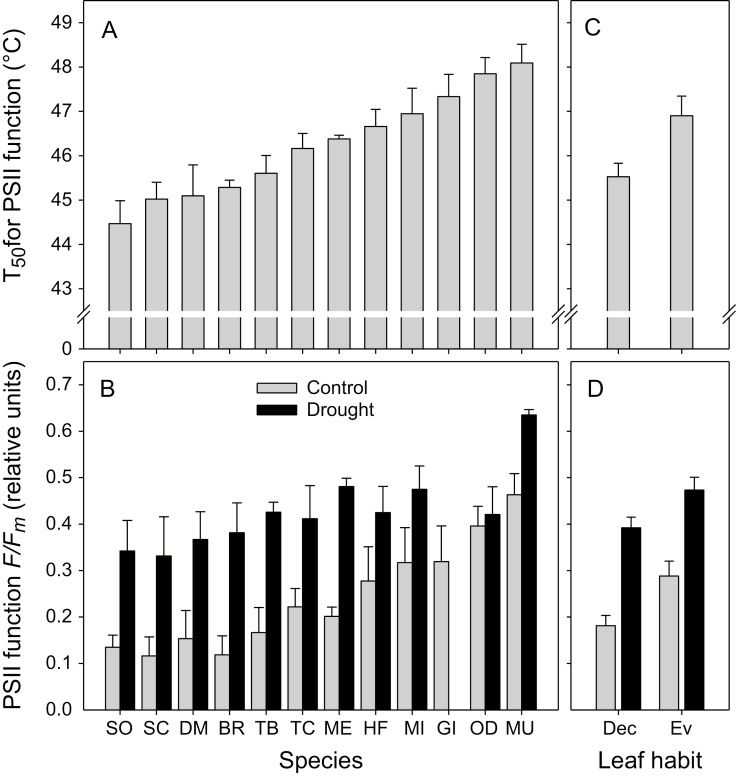
Figure 2.
Thermotolerance in the study species. (A) T50 of PSII function in control (well watered) plants. (B) PSII function (Fv /Fm) at 47.5 °C for control and drought-stressed plants. Error bars represent SE (n = 5–6). (C) and (D) Average thermotolerance for deciduous (Dec, n = 6) and evergreen (Ev, n = 6) leaf habits. Species names are provided in Supporting Information—Table S1.

