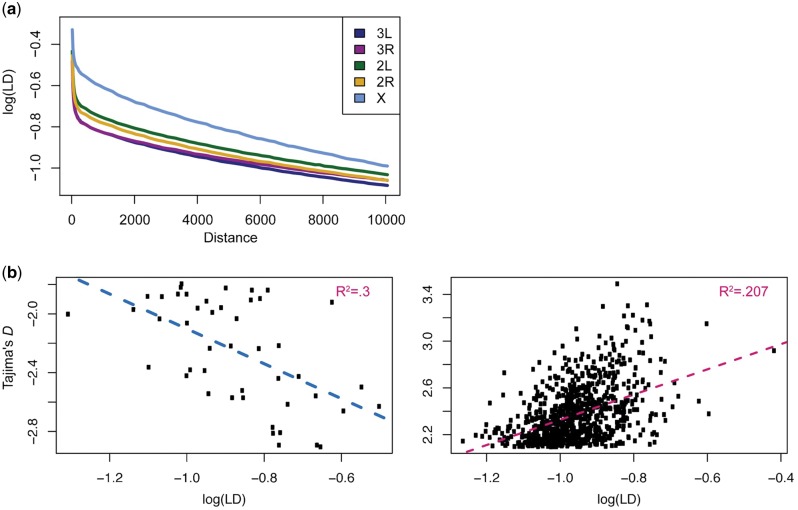
Fig. 3.—
Linkage disequilibrium. (a) Decay of linkage disequilibrium on the X and autosomes calculated by distance. LD is binned initially in windows of 20 bp until 300 bp and 150 bp thereafter. Shown is the log(LD) of the mean of each of these bins. Regions of low recombination have been filtered out. (b) The relationship between LD and outliers of Tajima’s D with regression lines plotted for negative and positive values of Tajima’s D separately. This is to highlight the possibility for different relationships between LD and Tajima’s D depending upon the selective regime—for example, that lower (higher) values of Tajima’s D may be associated with higher (lower) values of LD. The R2 value of for each of these lines is shown in the upper right hand corner of each graph.

