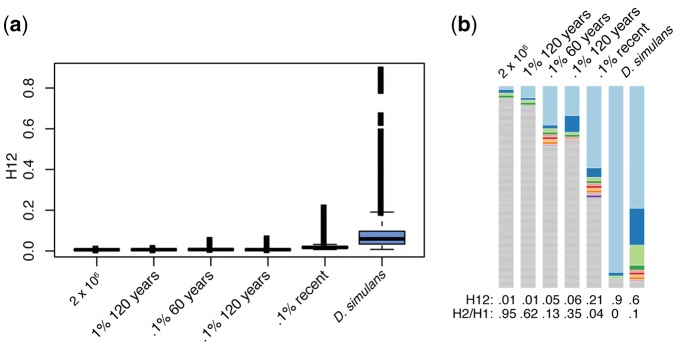
Fig. 5.—
Demographic simulations and H12. (a) The spread of H12 values in each of the demographic scenarios that were simulated. Demography does not substantially elevate Tajima’s D though population contraction does have more haplotype structure than the other demographic scenarios. (b) An example of the haplotype structure under each of the demographic scenarios, with the highest H12 value for each scenario shown. Again, the most frequent haplotype is shown in light blue and the second most frequent in dark blue. Gray regions indicate singletons.

