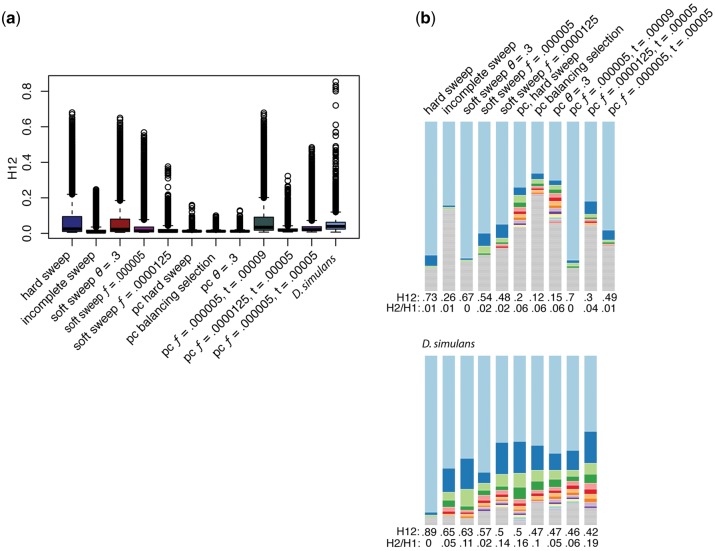
Fig. 6.—
Simulations of selection and H12. (a) The spread of H12 values for each of the simulations of selection. While demography and selection elevated Tajima’s D the most, they do not elevate H12 values the most. This may be due to the timing of selection, which had to be modeled differently for combinations of selection and demography. (b) Patterns of haplotype diversity in the top values of H12 from each simulation and Drosophila simulans. Note that we include the highest values of H12 for D. simulans from the autosomes, as these simulations pertain principally to autosomal variation. These selection scenarios are more similar to that observed in D. simulans than demography, however, the high frequency of the second haplotype in D. simulans was not recapitulated in any simulation.

