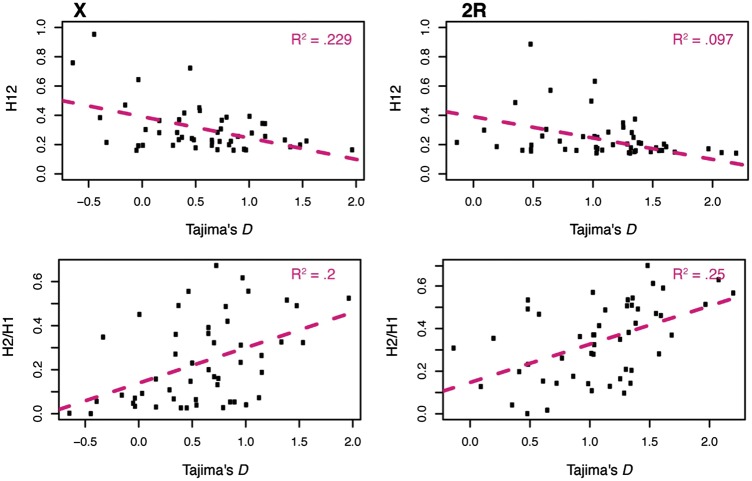
Fig. 7.—
H12. (a) Tajima’s D versus H12 and H2/H1. The average Tajima’s D value was calculated for intervals identified as the top 50 H12 scores for each chromosome. Intervals are defined as the smallest and largest edges of each peak, thus adjacent intervals with high H12 scores are considered a single peak. The slight negative relationship between H12 and Tajima’s D is significant for all chromosomes (P < 0.0001), and is expected given the decreasing ability of H12 to detect sweeps as they become softer (supplementary fig. S5, Supplementary Material online). A high value of H2/H1 and H12 indicates a soft selective sweep, so a positive relationship between Tajima’s D and H2/H1 indicates that soft selective sweeps are responsible for the high Tajima’s D values. The relationship is significant at P < 0.0003–0.002 for all chromosomes other than 3L (supplementary fig. S6, Supplementary Material online).

