Figure 3.

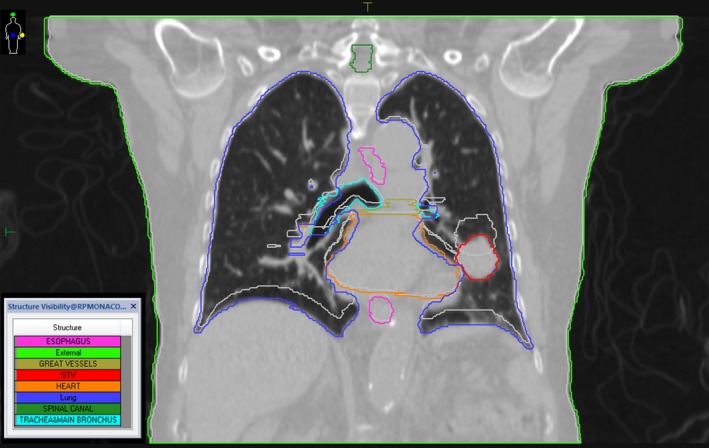
GTV and OAR contours on a coronal section for patient 1 at phase 0% (the colored contours) and phase 50% (the light gray contours). The CT image shown is that of phase 0%.

GTV and OAR contours on a coronal section for patient 1 at phase 0% (the colored contours) and phase 50% (the light gray contours). The CT image shown is that of phase 0%.