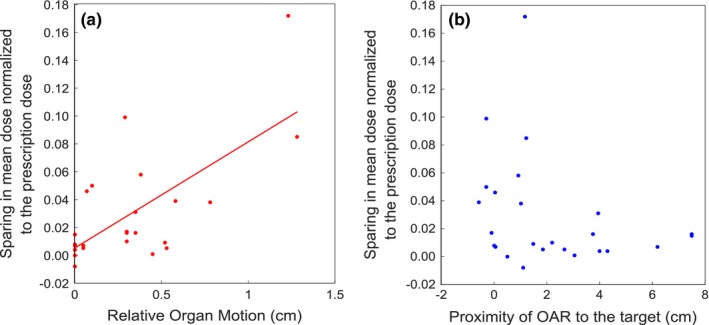
Figure 7.

Scatter plots illustrating the sparing in OAR mean dose as a function of relative organ motion (ROM) or proximity of OAR to the target, for all OARs. The solid line in (a) represents a linear curve fit to the data points. In (b), as the target to OAR distance increases beyond about 1.5 cm, there is little to no effect on dose sparing. For OARs in (b) that move into the target volume, the x‐axis data points are shown as less than zero.
