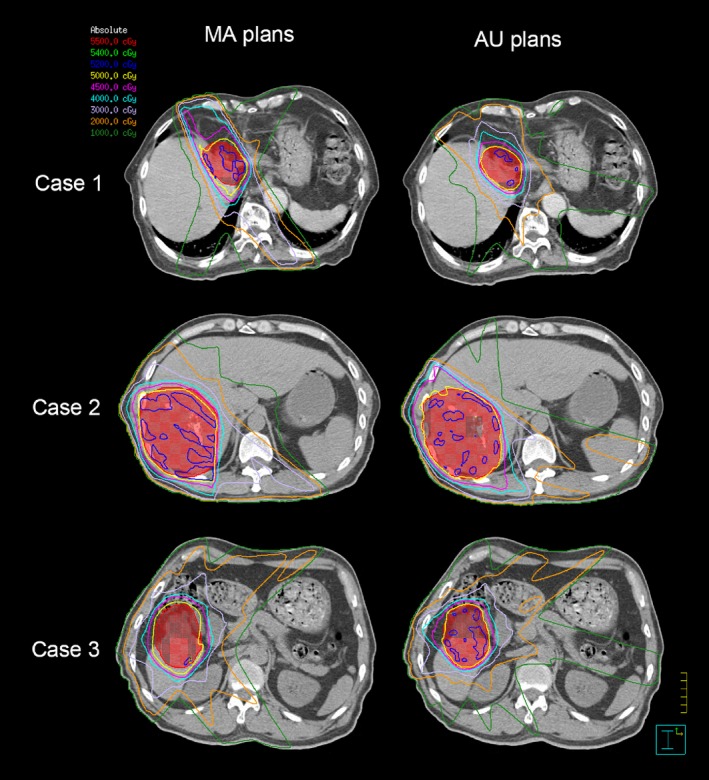
Figure 3.

Dose contours comparison of three patients in transverse. Iso‐dose curves are 5500 cGy (red), 5400 cGy (green), 5200 cGy (blue), 5000 cGy (yellow), 4500 cGy (purple), 4000 cGy (skyblue), 3000 cGy (lavender), 2000 cGy (orange), 1000 cGy (forest). The PTV is shown in red with both contour and colorwash.
