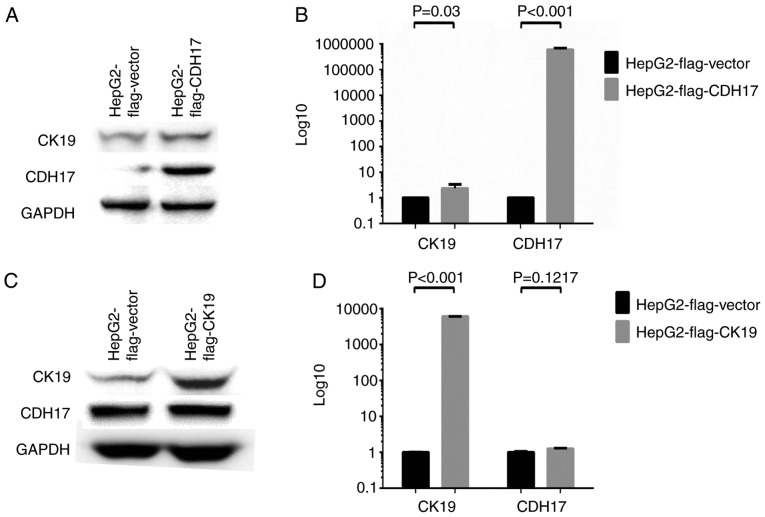
Figure 5.
Over-expression assays to study causal relationships. (A and B) Over-expression study by transfecting HepG2 cells with FLAG®-CDH17 [pCMV6-Entry (OriGene™) with CDH17 gene incorporated] or FLAG®-vector [pCMV6-Entry (OriGene™)]. Western blot analysis showed that the expression of both CDH17 and CK19 increased significantly after transfecting HepG2 with FLAG®-CDH17 (A). Real-time qPCR revealed that the transcripts of both CDH17 and CK19 were significantly increased in HepG2 FLAG®-CDH17 cells (P<0.001 and 0.03, respectively) (B). (C and D) Over-expression study by transfecting HepG2 cells with FLAG®-CK19 [pCMV-3Tag-8 (Invitrogen™) with CK19 gene incorporated] or FLAG®-vector [pCMV-3Tag-8 (Invitrogen™)]. Western blot analysis showed that the expression of CK19 increased significantly after transfecting with FLAG®-CK19. However, the expression of CDH17 remained unchanged after CK19 over-expression (C). Real-time qPCR revealed that the transcripts of CK19 were significantly increased in HepG2 FLAG®-CK19 cells (P<0.001). However, the transcripts of CDH17 were not altered by CK19 over-expression (P=0.1217) (D). In other words, CDH17 was not downstream to CK19. It was upstream to CK19 and, like CK19, was regulated by EGF. The experiment of real-time qPCR was conducted in triplicates. CDH17, cadherin 17; CK19, cytokeratin 19; EGF, epidermal growth factor.

