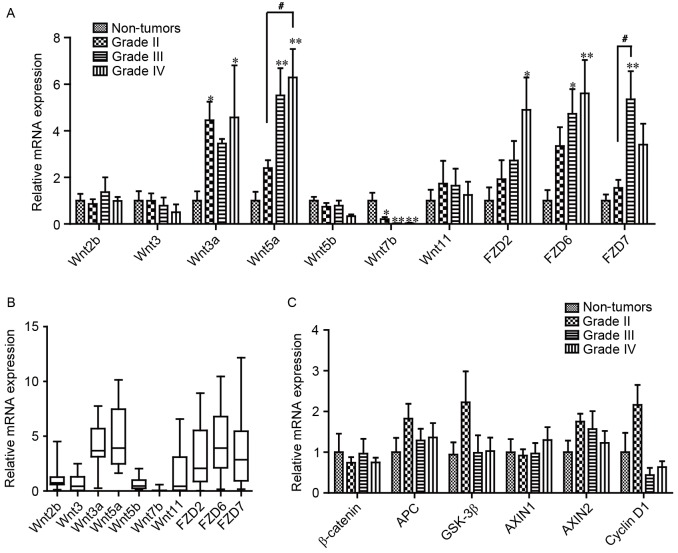
Figure 2.
Wnt signaling mRNA expression levels in glioma tissue samples. mRNA expression levels of select Wnt and FZD molecules (A) between varying grades of glioma tissues and normal brain tissue, with results presented as mean ± standard error of the mean, and (B) in glioma, presented as quartiles. (C) mRNA expression levels of β-catenin and its target genes in glioma tissues were quantified using quantitative polymerase chain reaction. Non-tumor brain tissue (n=8), grade II glioma specimens (n=8), grade III glioma specimens (n=8) and grade IV glioma specimens (n=8). mRNA expression levels were presented as the proportion of the mRNA expression levels in non-tumor brain tissues. *P<0.05, **P<0.01 and ***P<0.001 vs. non-tumor brain tissue; #P<0.05 as indicated. FZD, frizzled; GSK-3β, glycogen synthase kinase-3β.

