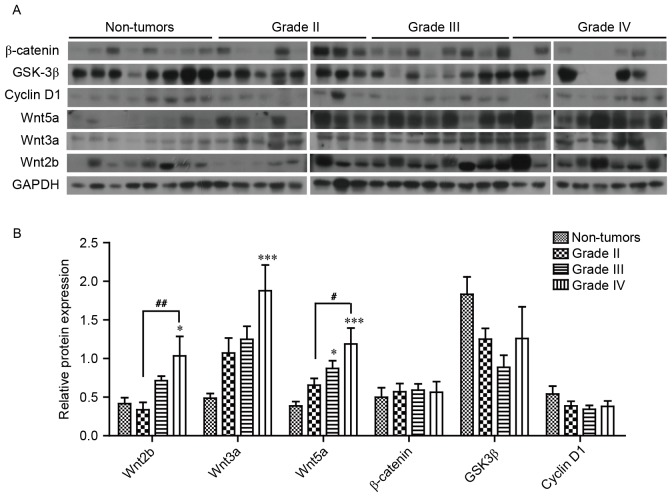
Figure 3.
Wnt signaling protein expression level in glioma tissue samples. The protein expression levels of Wnt molecules in non-tumor and glioma tissue were analyzed using (A) western blot analysis that was then (B) quantified. Non-tumor brain tissues (n=11, 8 cases presented), grade II glioma specimens (n=12, 8 cases presented), grade III glioma specimens (n=11, 8 cases presented) and grade IV glioma specimens (n=14, 8 cases presented) were included. Relative protein expression levels were expressed as the proportion of the total protein levels in non-tumor brain tissues. Results are presented as mean ± standard error of the mean. *P<0.05, **P<0.01 and ***P<0.001 vs. non-tumor brain tissue; #P<0.05 and ##P<0.01 as indicated. GSK3β, glycogen synthase kinase 3β.

