Figure 3.
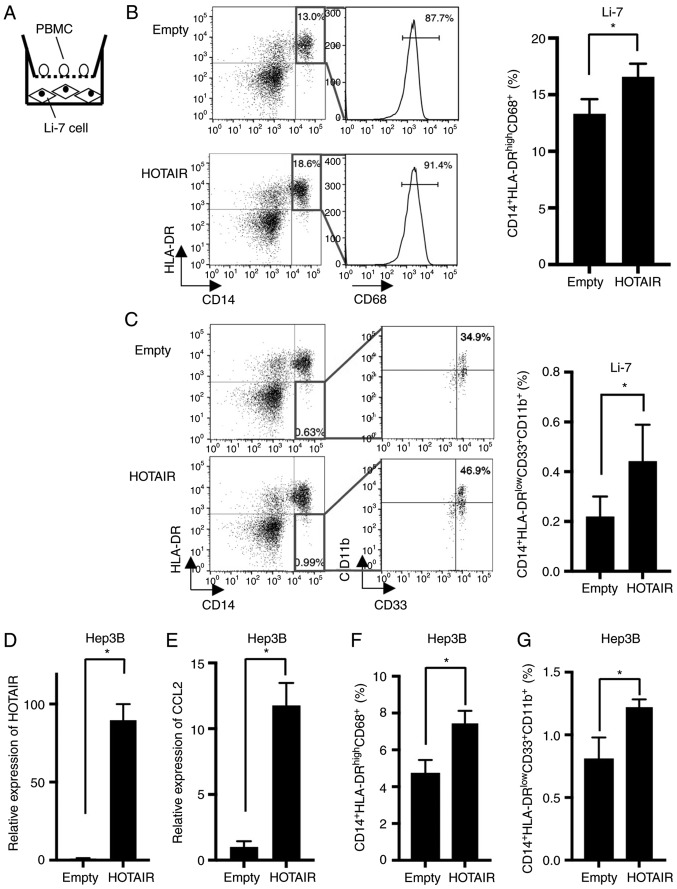
HOTAIR overexpressing Li-7 increased the proportion of macrophage. (A) A scheme of the co-culture assay. (B) (Left) Representative dot plots of PBMC co-cultured with Li-7 cells after 72 h. Macrophages were found in CD14+CD68+HLA-DR+ gate. (Right) Quantification of macrophages of PBMC co-cultured with HOTAIR-overexpressing and control Li-7 cells. *P=0.0031, n=5. (C) (Left) Representative dot plots of PBMC co-cultured with Li-7 cells after 72 h. MDSCs were found in CD14+ HLA-DRlow/−CD33+CD11b+ gate. (Right) Quantification of MDSCs of PBMC co-cultured with HOTAIR-overexpressing and control cells. *P=0.018, n=5. (D) HOTAIR expression in Hep3B cells transduced with a HOTAIR-overexpressing (HOTAIR) or empty vector (Emtpy), determined by real-time PCR. HOTAIR expression was normalized to Empty cells. *P=0.0001, n=3. (E) CCL2 expression determined by real-time PCR in Hep3B cells. HOTAIR expression was normalized to Empty cells. *P<0.0001, n=4. (F) Quantification of macrophages of PBMC co-cultured with HOTAIR-overexpressing and control Hep3B cells. *P=0.0007, n=4. (G) Quantification of MDSCs of PBMC co-cultured with HOTAIR-overexpressing and control Hep3B cells. *P=0.0014, n=4.

