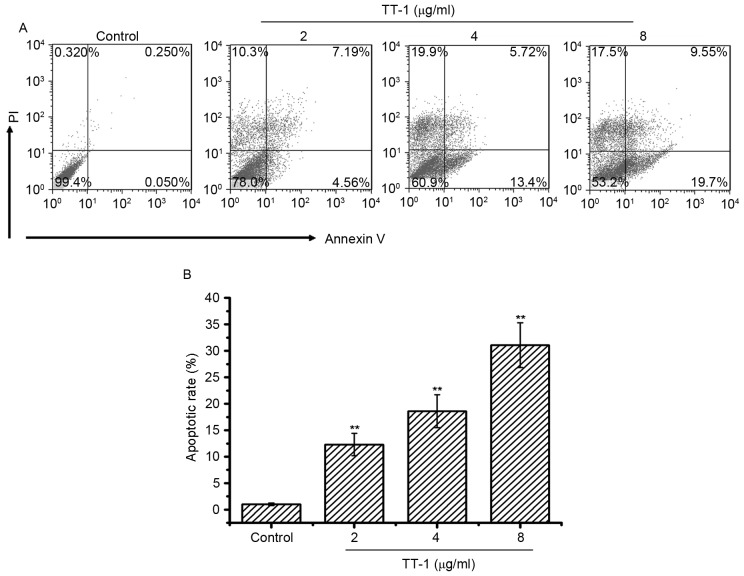
Figure 2.
Induction of apoptosis by TT-1 in TT cells. (A) Cell apoptosis analysis of TT cells was conducted by flow cytometry using Annexin V/PI staining. Following the exposure of TT cells to 0–8 µg/ml TT-1 for 48 h, the attached and detached cells were collected. Following staining with Annexin V and PI, the cells were subjected to flow cytometric analysis. Annexin V+PI+ cells were considered to be late apoptotic cells, while Annexin V+PI− cells were considered to be early apoptotic cells. (B) Bar chart showing the percentage of apoptosis. Respective data from ≥3 independent experiments are summarized and presented as the mean ± standard deviation. **P<0.01 vs. the control group. PI, propidium iodide.

