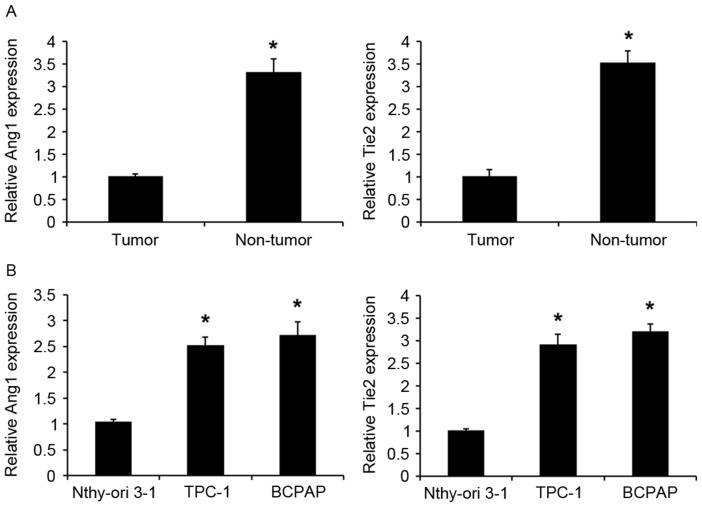
Figure 1.
Expression levels of Ang1 and Tie2 in PTC tissues and cell lines. (A) An RT-qPCR assay detected the expression of Ang1 and Tie2 in PTC and adjacent normal tissues. Data are presented as the mean ± standard deviation from three independent experiments. *P<0.01 vs. normal tissue. (B) An RT-qPCR assay detected the expression of Ang1 and Tie2 in PTC TPC-1 and BCPAP cell lines and human thyroid follicular epithelial cells (Nthy-ori 3-1). Data are presented as the mean ± standard deviation from three independent experiments. *P<0.01 vs. Nthy-ori 3-1 cell line. Ang1, angiopoietin 1; Tie2, Ang receptor; PTC, papillary thyroid carcinoma; RT-qPCR, reverse transcription-quantitative polymerase chain reaction.

